Linguistic books often include maps which give the location and surroundings of the varieties under investigation. As such, these maps provide very valuable background information about the setting. Unfortunately, very often the maps included in submissions we get cannot be printed. This has two reasons:
- we cannot print copyrighted maps. Most maps from other books are copyrighted and as such not usable by us, but also maps from the Internet (e.g. GoogleMaps or Ethnologue) are copyrighted.
- the map is in bad resolution. Screenshots are typically 72 dpi (dots per inch), but for good printing quality, we need 300 dpi, otherwise the picture looks blurry on paper (it may look OK on a screen though).
This blogpost is about creating simple maps which do not have either of these problems with the free software Inkscape. For an experienced user, this can be done within an hour or so; novices will need some more time.
-
- Screenshot from OpenStreetMap
-
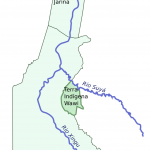
- Redrawn map
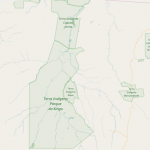
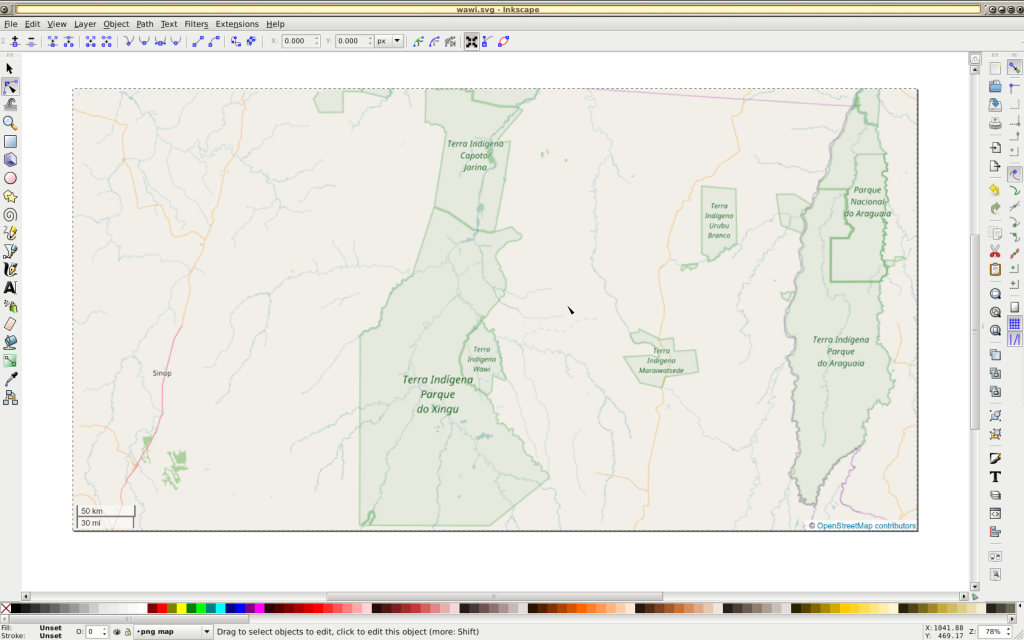
We use a map for the Wawi region of Brazil from an upcoming volume to illustrate the procedure, starting with a screenshot from the free mapping service OpenStreetMap.
 We could use this Map in our publication legally, but upon inspection, we find that it has some details we do not need (smaller rivers), while other detail is missing, most notably river names. Furthermore, the resolution is bad, which is clear when zooming in.
 Setup
Setup
To start our Inkscape project, we create a folder for the map on our computer and put our screenshot there for a start.
We the open the program Inkscape and create a couple of layers for the elements we are interested in, in this case our screenshot as a base, the rivers, the Wawi reserve and the Xingu reserve, and labels.
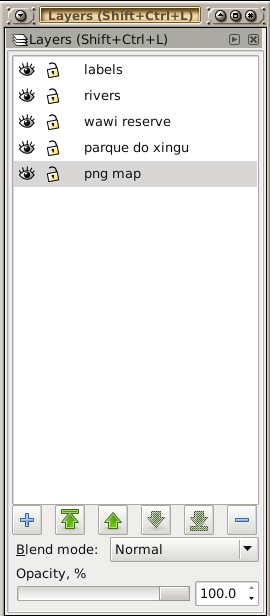 We import our screenshot on the png map layer.
 Rivers

We now set the basemap layer and the river layer to visible. Using the line tool (Shift+F6), we roughly trace the river.
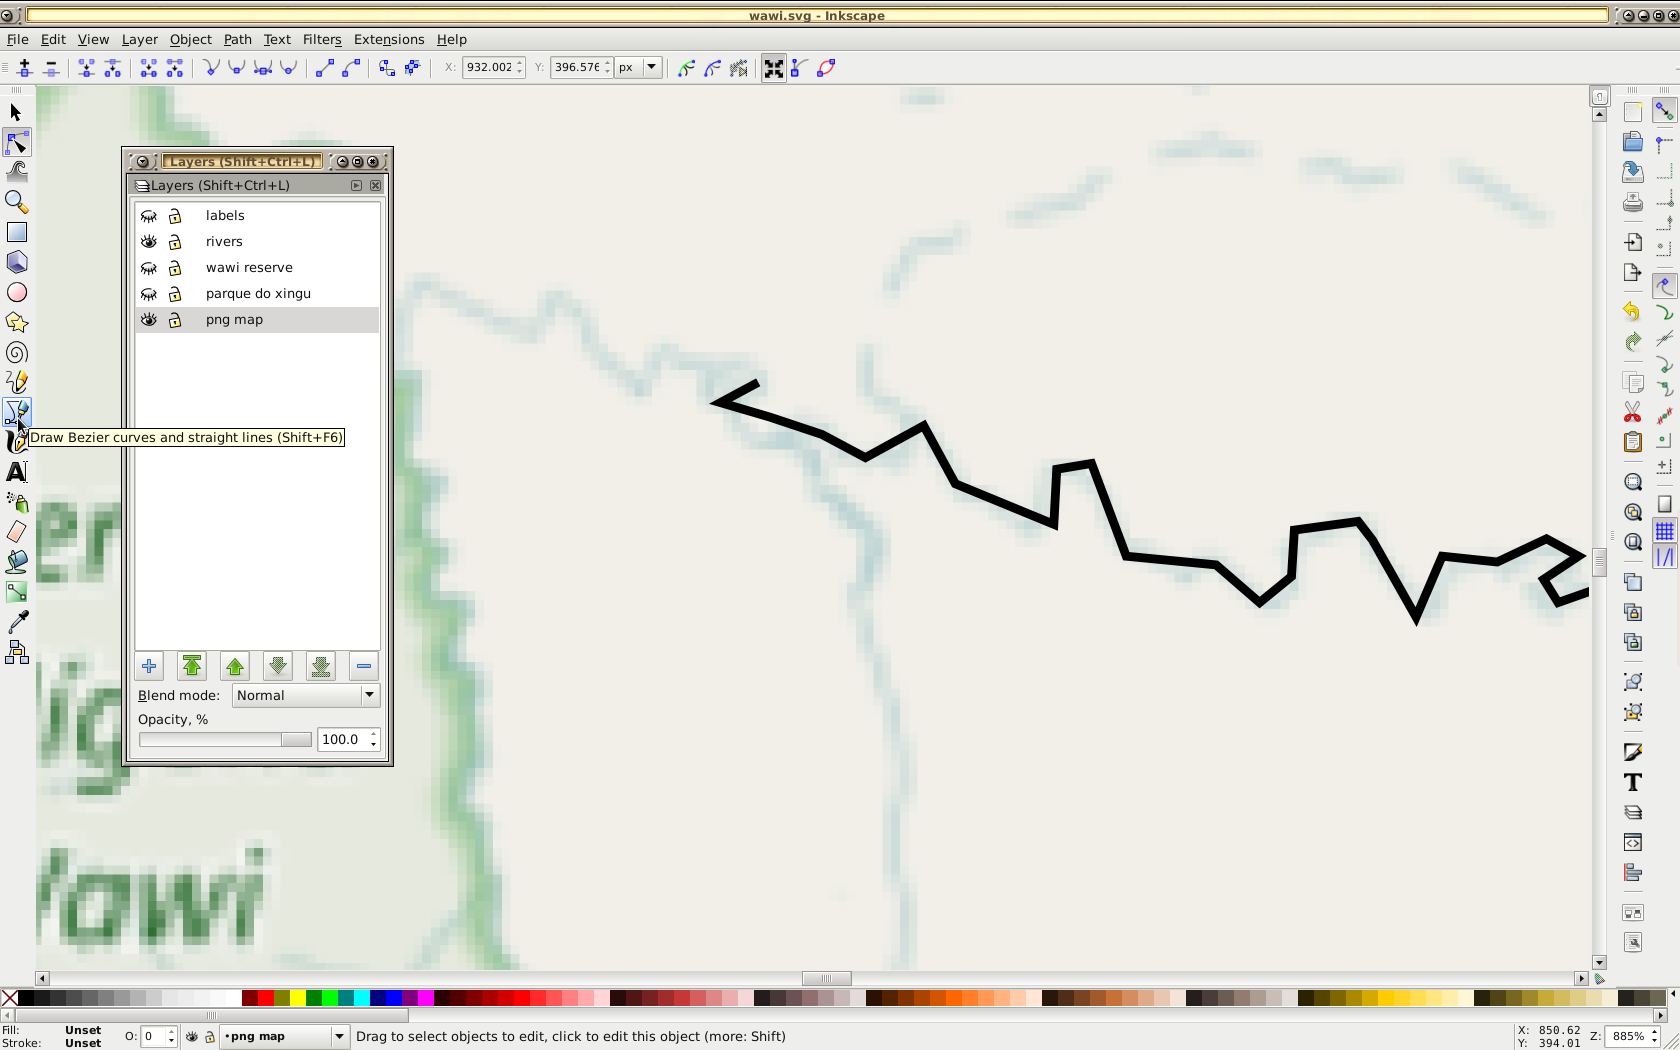 Notice that the path has sharp edges. Since rivers have meanders, we set the segments to curves (rather than straight lines and make the nodes smooth (rather than edges)
 That looks better, but our river is black.
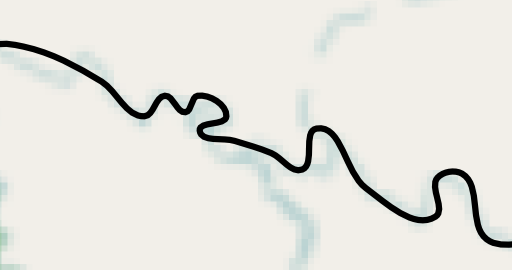 We select the river and set the stroke color to a muted blue.
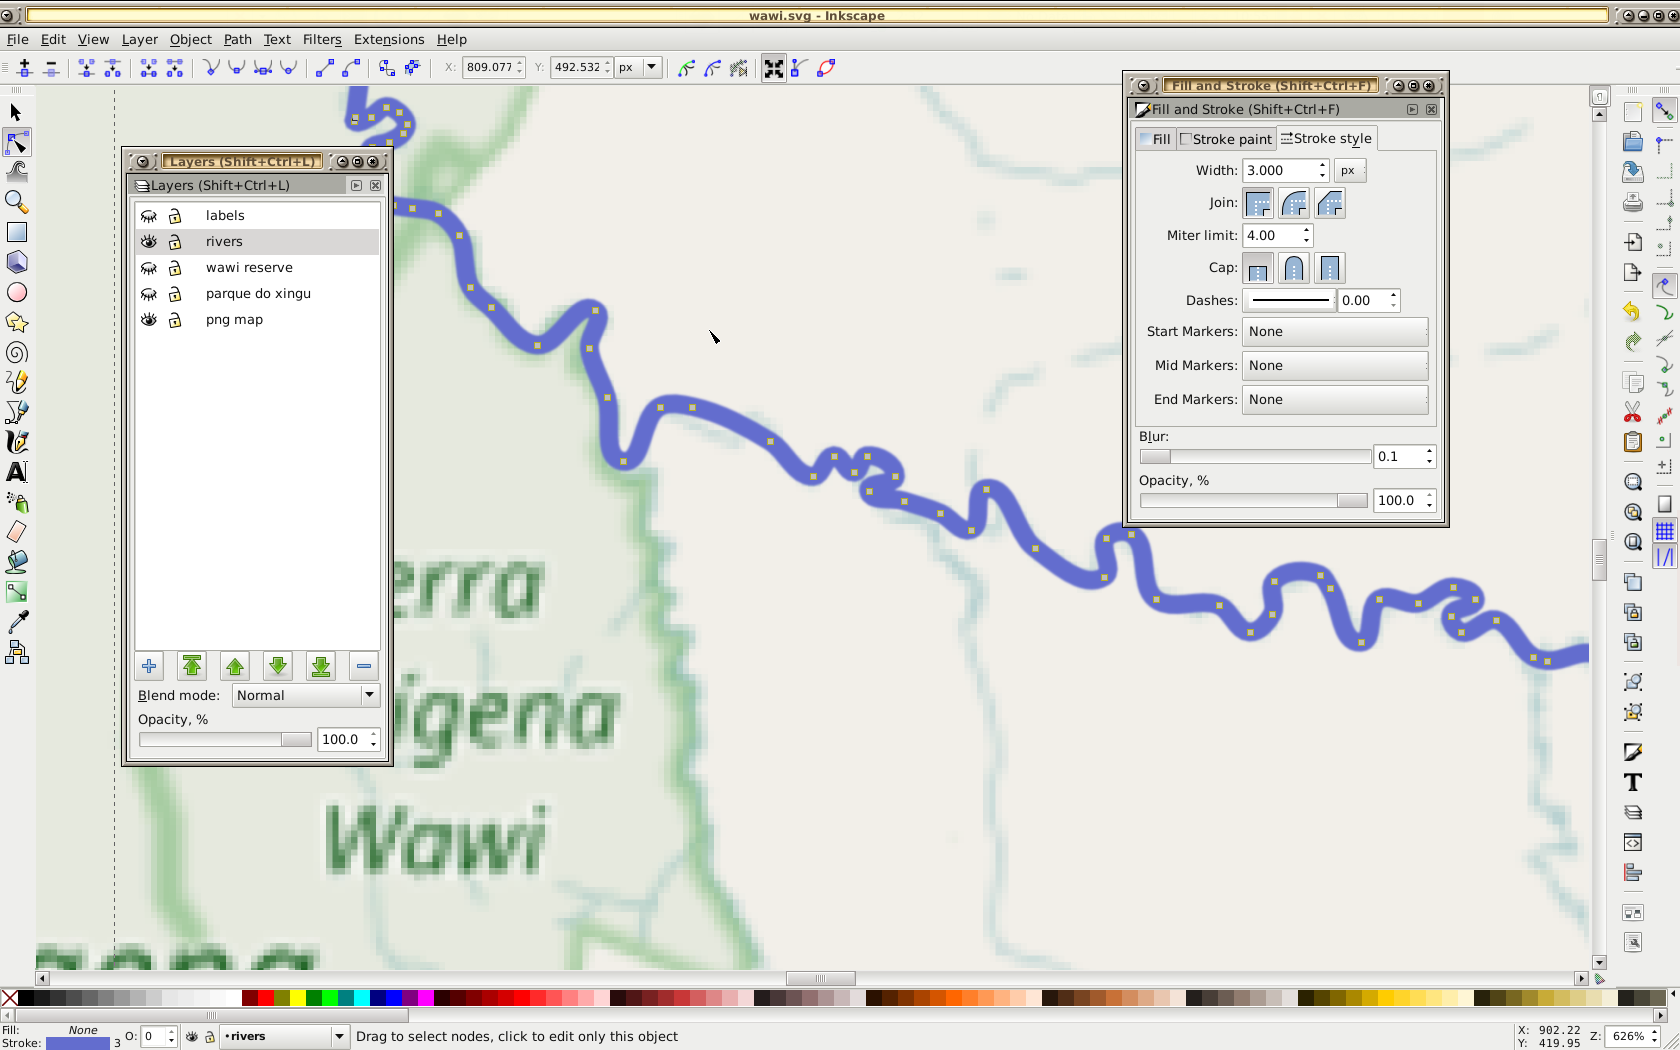
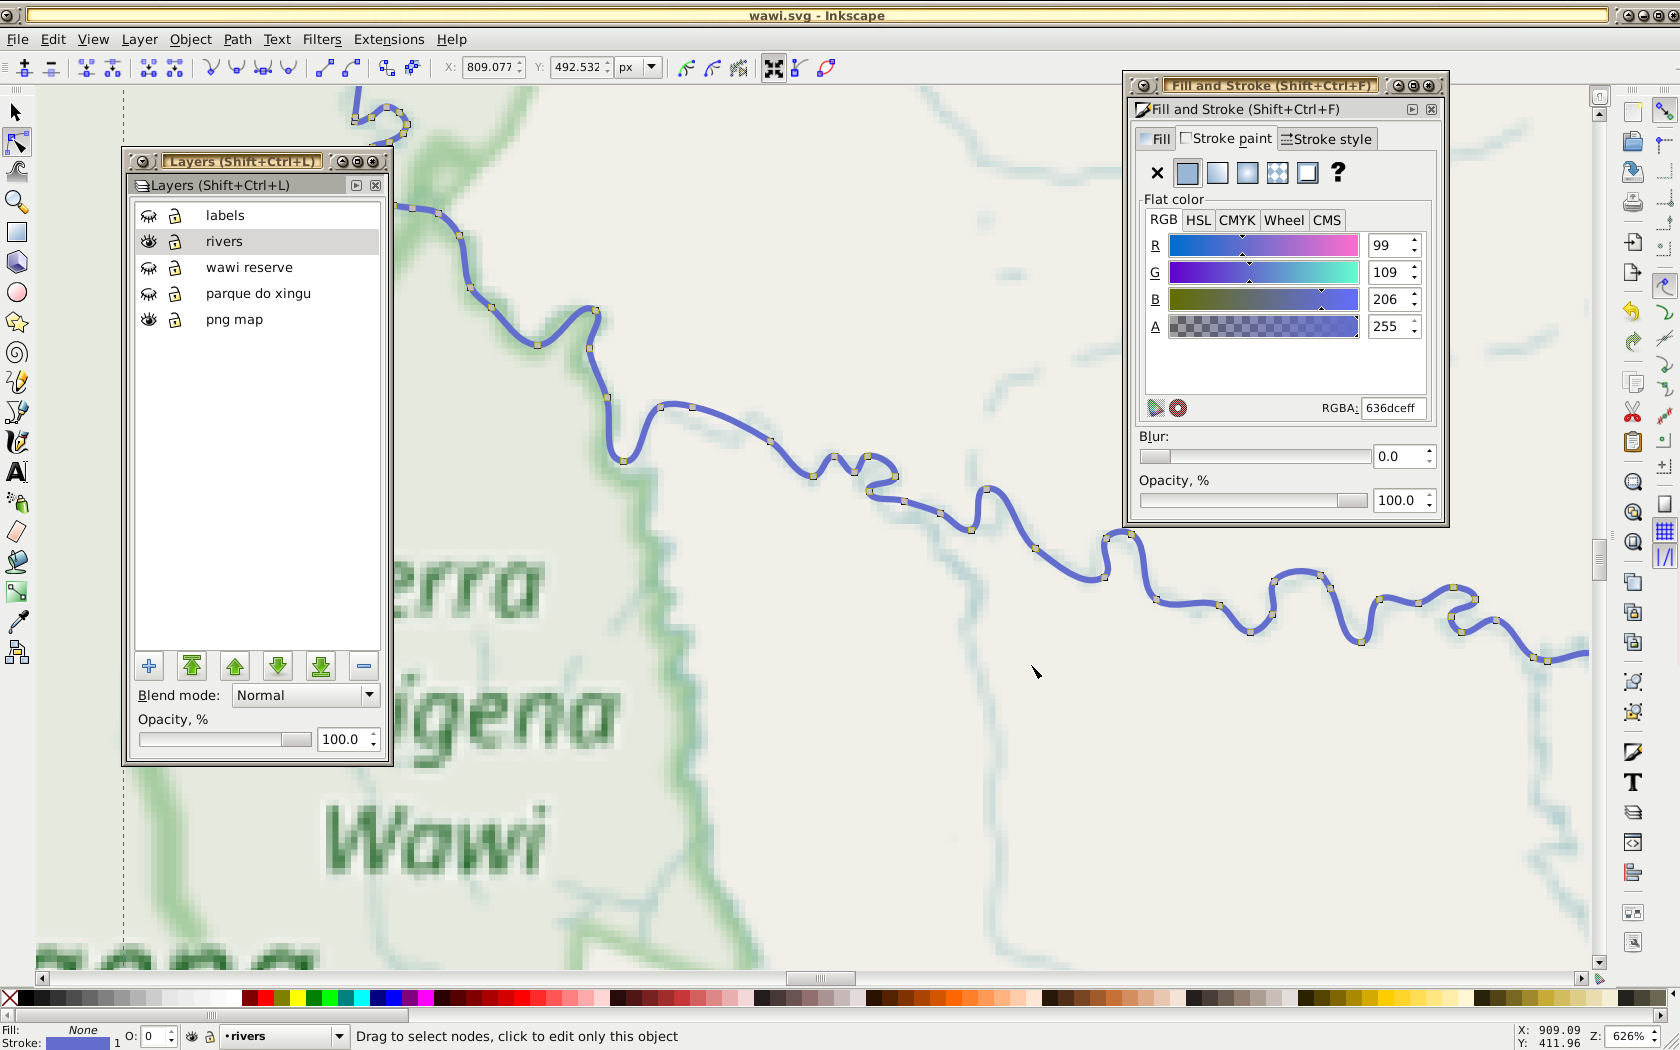 The river is an important feature, so we make it a little bit wider (3 px). As a bonus, we blur the stroke a bit (0.1) to distinguish it from roads or borders.
Regions
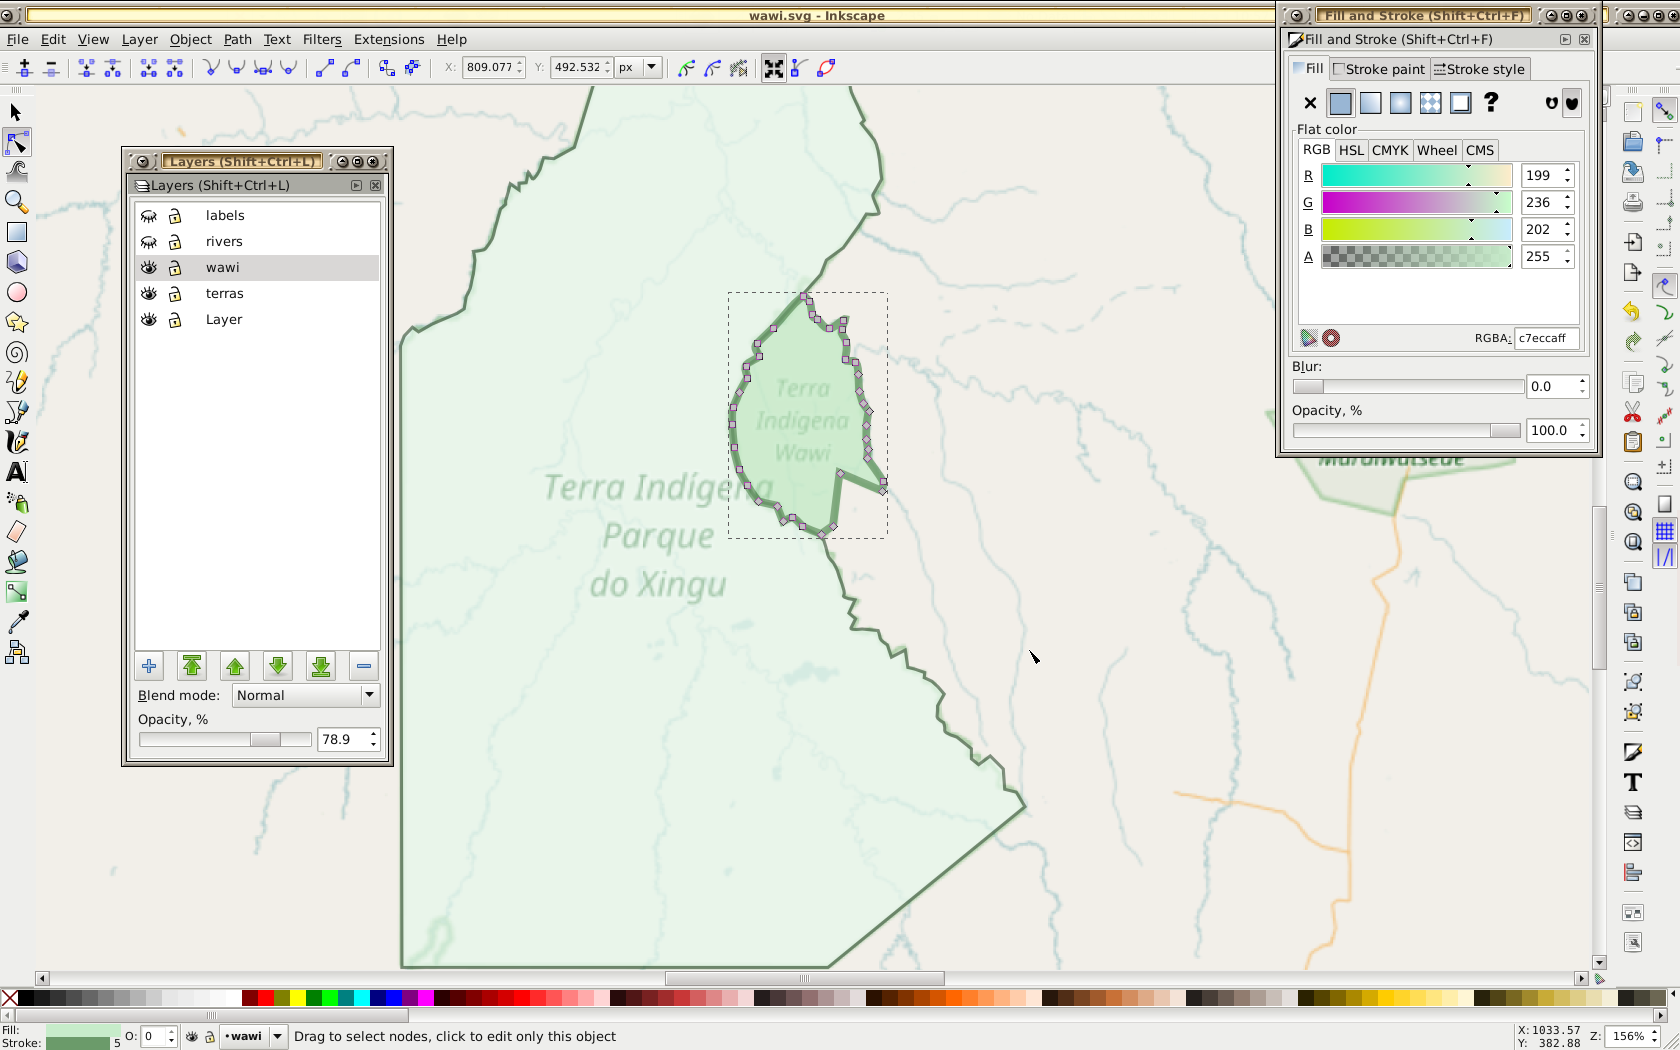
Next step will be the regions. We set the river layer to invisible, and set the region layers to visible. We trace the regions as before (Shift+F6). Next to the stroke color, and in distinction to the rivers, we also set a fill color here. No blur for region borders.
 Finally, we set the labels layer to visible and add some labels (F8). The base map layer is set to invisible to avoid distraction
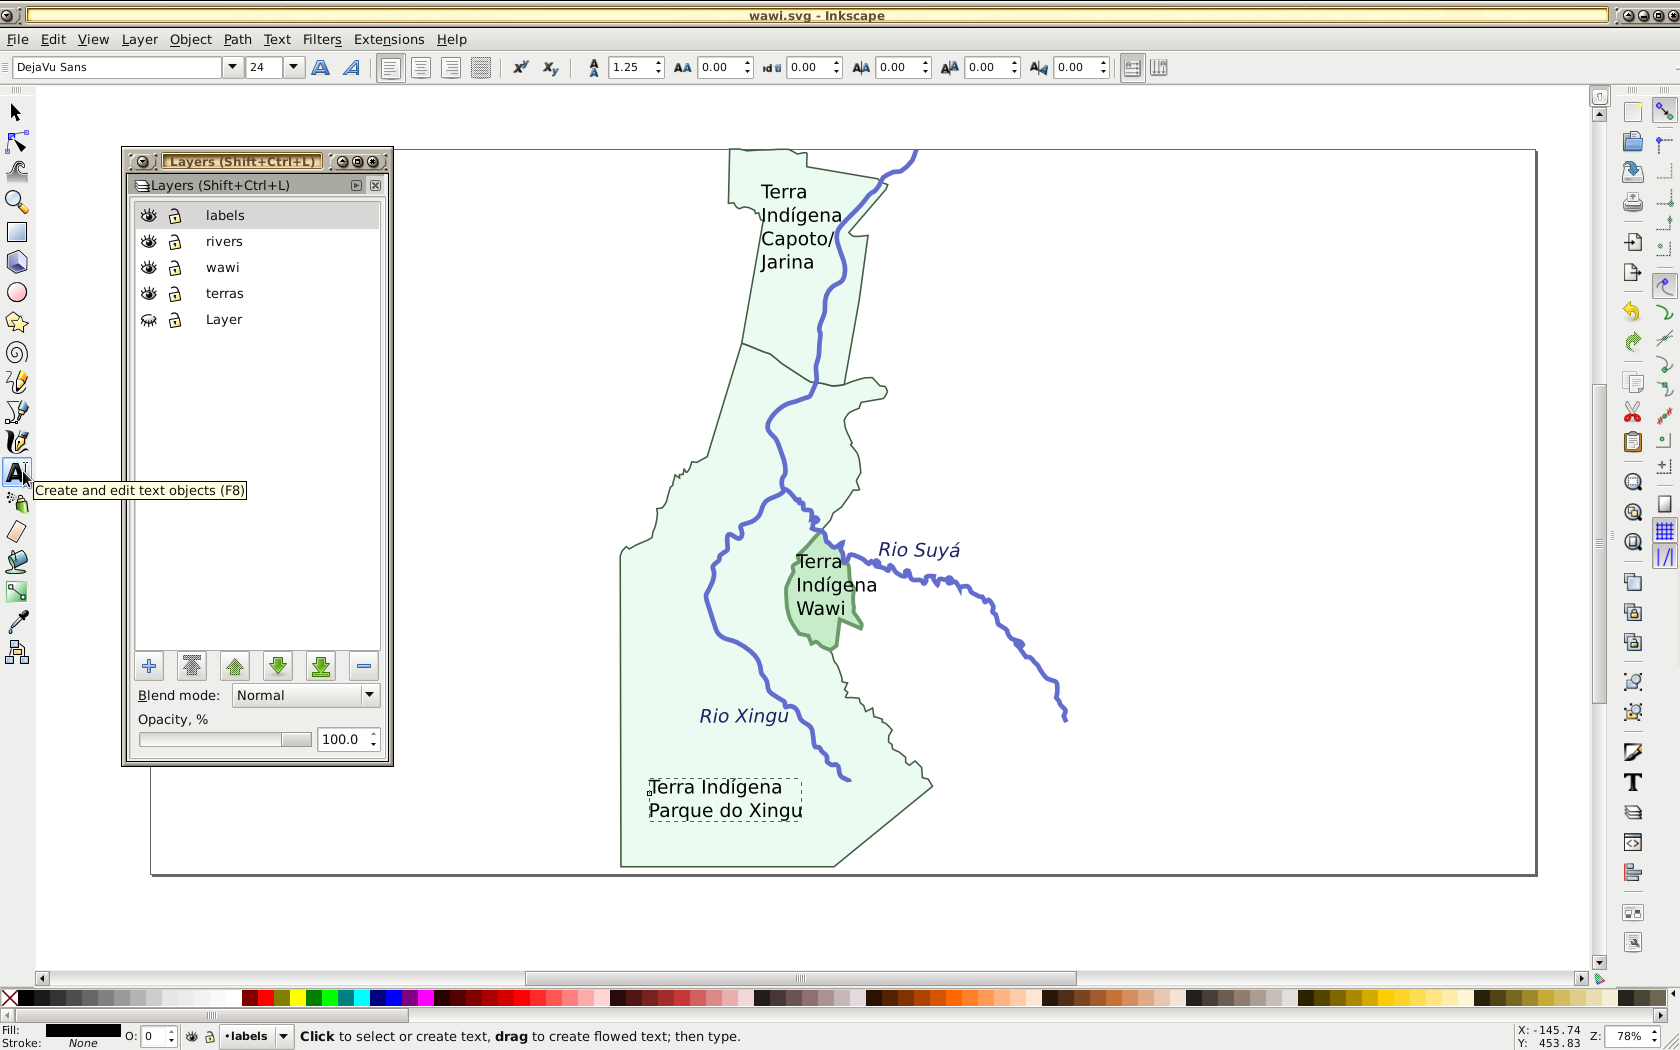 The labels for the rivers should follow the course, so we use the select tool (F1) and click twice on the labels to be able to rotate them freely.
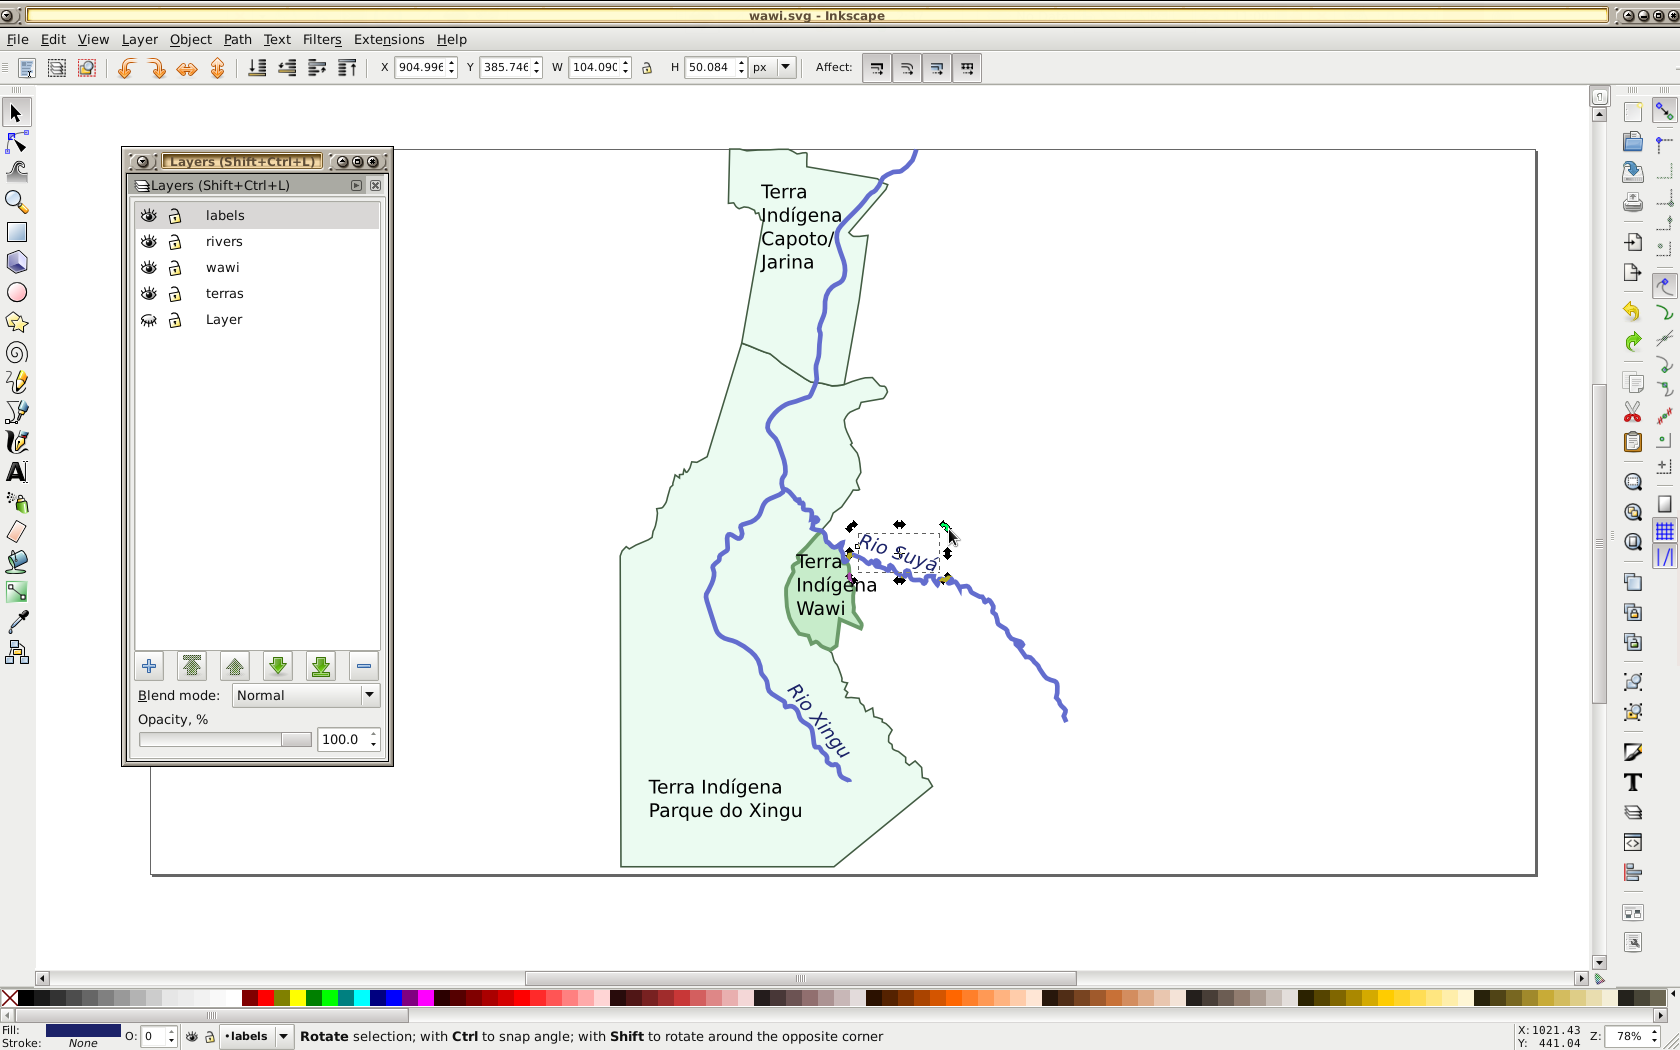 We now have all elements we need, but our map is much larger than the region we are interested in. We select (F1) the elements most to the north, south, east, and west and then adjust the image dimensions.
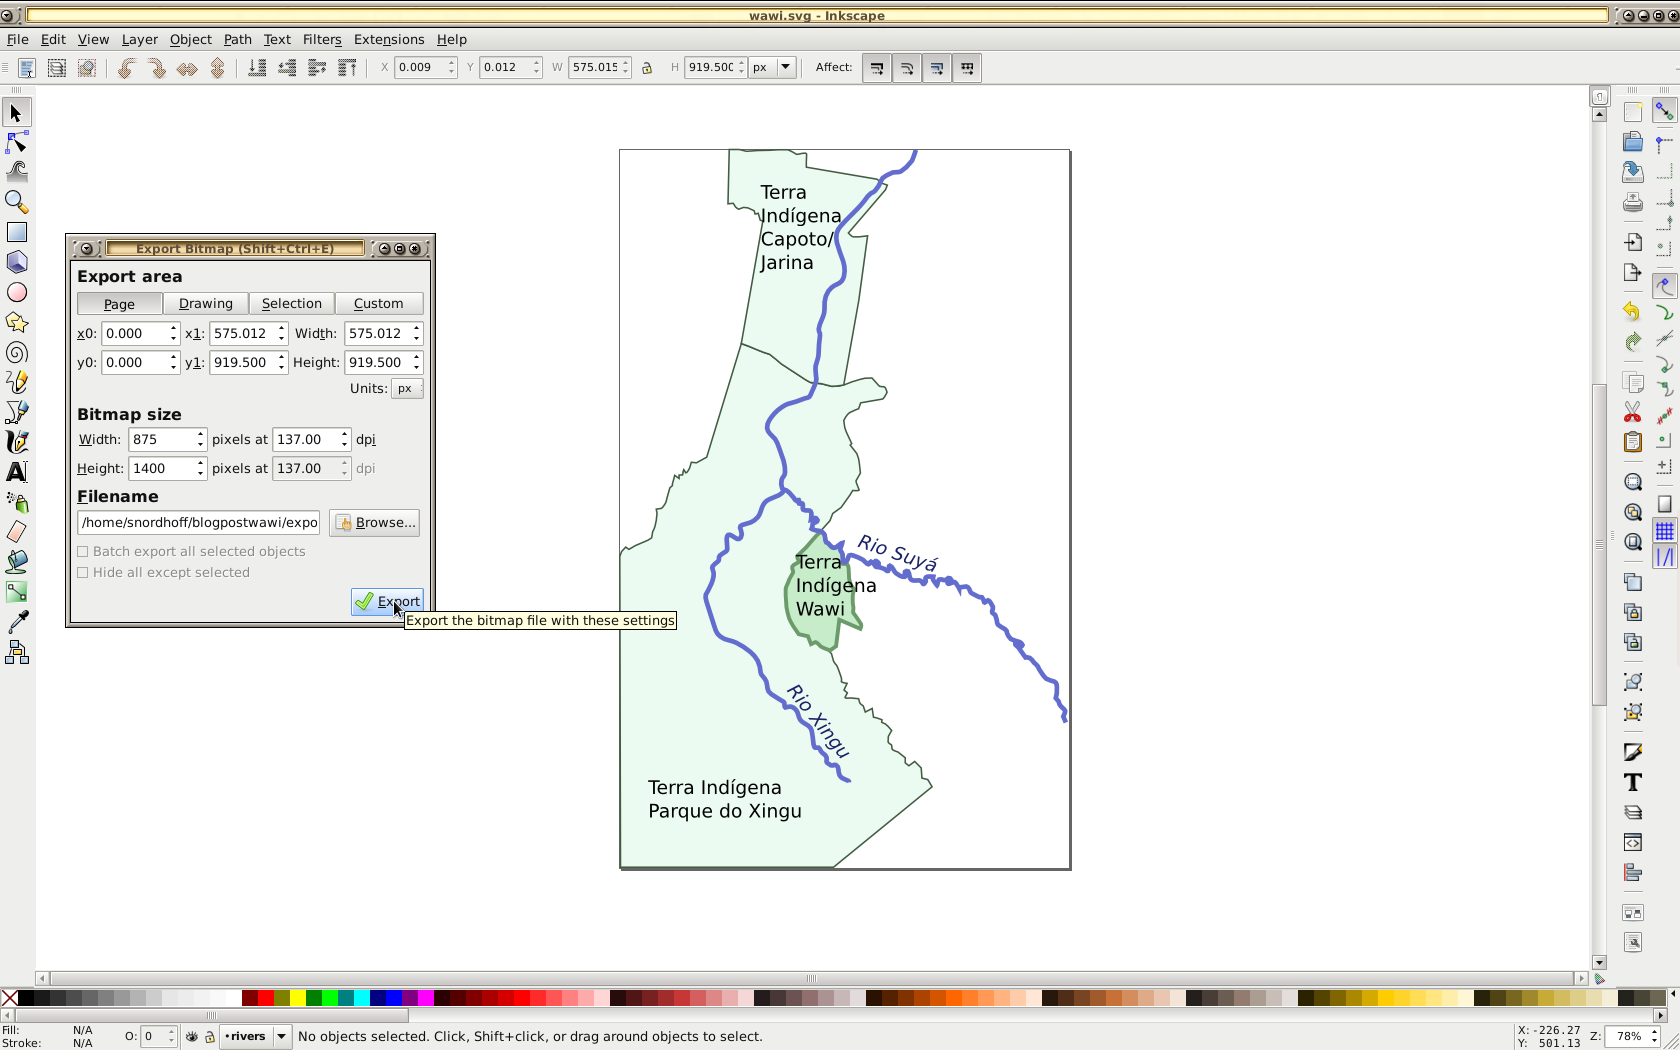
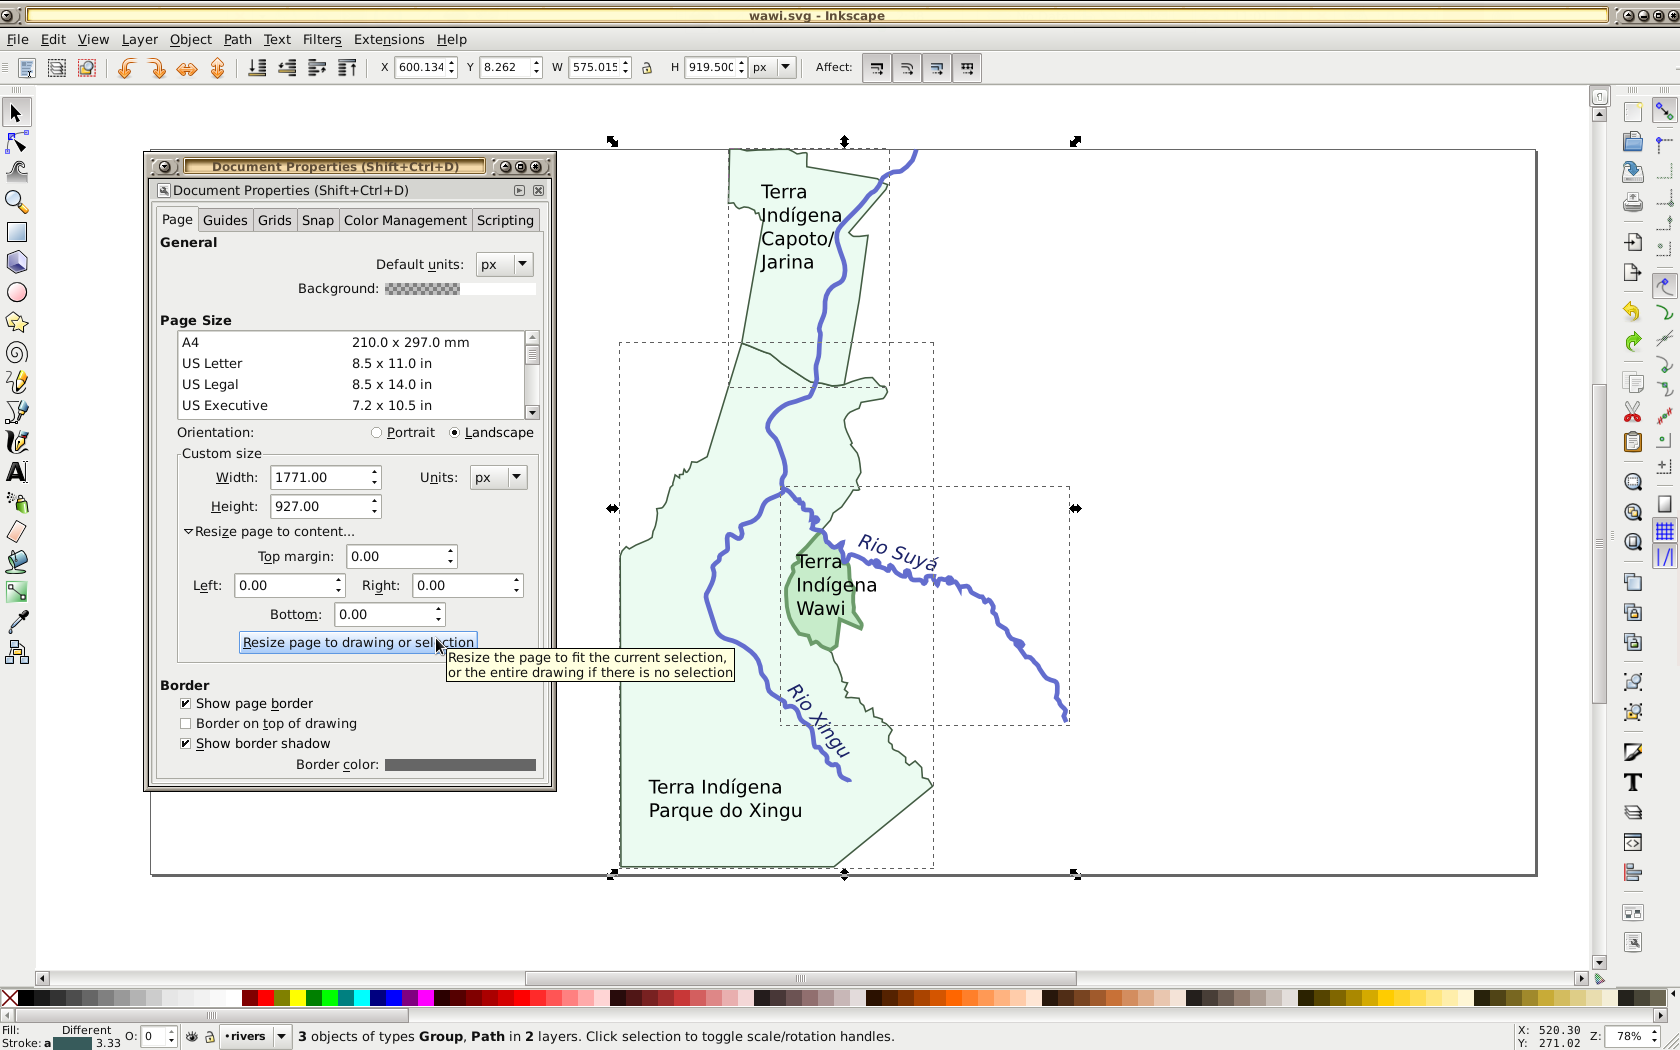 We can now save our image as *svg or *pdf or we can export it to *png.
 Conclusion
The basic problems we wanted to address were copyright issues and resolution. This map has been drawn entirely by me, so I own the copyright and can do with it whatever I want. First issue solved. As for the second issue, the graphics produced by Inkscape are so called vector graphics, which can be printed at arbitrary solutions, which can be shown by zooming in. I have no background in graphics design, and there are certainly various visual features which can be improved by people with the relevant expertise. But for the use case of giving the location of a language with relevant geographic features in a format suitable for printing, this is a good start.
For more complex maps than this one, we have also used the program Maperitive, which can directly access the Open Street Map cartographic data and export it as *svg. However, the procedure sketched above is suitable for most maps included in our books so far.
The Inkscape program is available for free for Windows, Mac, and Linux.
I would like to propose an R package lingtypology that can produce the map of good resolution with OpenStreet tiles.
Here is a manual: https://ropensci.github.io/lingtypology/
Thanks, George, this looks very nice, especially for typological/variationist work.
Is there some way to get vector data instead of tiles for easier post-editing?