Linguistic books often include maps which give the location and surroundings of the varieties under investigation. As such, these maps provide very valuable background information about the setting. Unfortunately, very often the maps included in submissions we get cannot be printed. This has two reasons:
- we cannot print copyrighted maps. Most maps from other books are copyrighted and as such not usable by us, but also maps from the Internet (e.g. GoogleMaps or Ethnologue) are copyrighted.
- the map is in bad resolution. Screenshots are typically 72 dpi (dots per inch), but for good printing quality, we need 300 dpi, otherwise the picture looks blurry on paper (it may look OK on a screen though).
This blogpost is about creating simple maps which do not have either of these problems with the free software Inkscape. For an experienced user, this can be done within an hour or so; novices will need some more time.
-
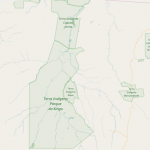
- Screenshot from OpenStreetMap
-
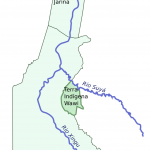
- Redrawn map